THE LONG GAME
2016 — 2025
← All investorsTHE ARENA · INVESTOR PROFILE
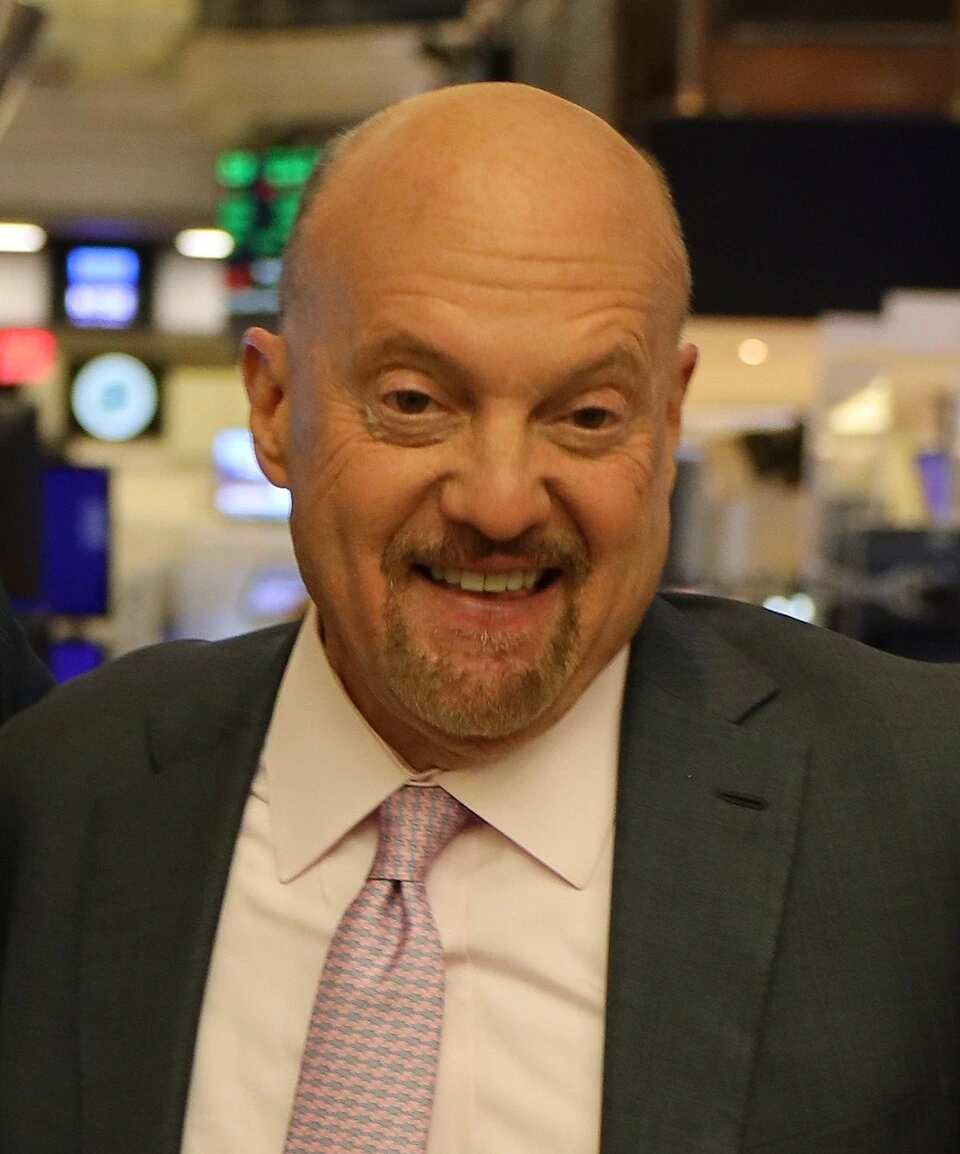
Jim Cramer — Licensed original color photograph
RECORD STATUSUnranked
No verdict yet
Comparable data needed
Public equities

Jim Cramer

CNBC’s Mad Money

Jim Cramer is the television investing personality behind CNBC’s Mad Money. His energetic stock discussions made him a familiar face to individual investors; his Charitable Trust is a separate portfolio with its own investment record.

CNBC · 15 years of Mad Money ↗
ASSOCIATED WITHCNBC · Charitable Trust

No rarity, verdict or leaderboard position is assigned until a comparable return record is verified.

THE PERFORMANCE TEST

The benchmark to beat.

$10,000 invested at the start of 2016, held through December 2025. No extra deposits. The line below shows the S&P 500 only.

Jim Cramer’s comparison is not available yet.

CNBC’s investing personality and the public face of its Charitable Trust. A continuous return history and its cash-flow treatment still need verification. The trust’s results and the performance of every stock mentioned on television are different things.

Jim CramerNot availableA verified return series is required
SPX via SPY ETF$39,468+14.7% per year
Difference vs SPX—Unranked · insufficient data
USD $0k$20k$40k$60k 201520172019202120232025
December 2025 · SPX $39,468

SPX is the S&P 500 index; this comparison uses SPY ETF total returns as the investable benchmark. Values are in USD, with distributions reinvested where applicable. Each point is a year-end observation, not a daily price. Past returns do not predict future results.

RISK & CONSISTENCY

The ride behind the return.

2016–2025 · 10 YEARS
YEAR-END OBSERVATIONS ONLY

Maximum year-end drawdown

This comparison measures only the largest drop between year-end values; losses within a year can be much larger. The latest card estimate, where available, is described separately below.

Jim Cramer—

Return record unavailable

A comparable history is needed.
SPX · via SPY−18.2%

Dec 2021 → Dec 2022

Recovered by Dec 2023
Bar length shows loss on a 0–100% scale.

Total return

Jim Cramer
—Return record unavailable
SPX via SPY
+294.7%10-year cumulative

Best year

Jim Cramer
—Return record unavailable
SPX via SPY
+31.2%2019

Worst year

Jim Cramer
—Return record unavailable
SPX via SPY
−18.2%2022

Positive years

Jim Cramer
—Return record unavailable
SPX via SPY
8 / 10Years with a gain

Years beating SPX

Jim Cramer
—Return record unavailable
SPX via SPY
—Comparison baseline

The comparison above uses the selected period through December 2025. Annual figures are approximate; rounded returns can affect close comparisons. A positive year can still include a large drawdown.

How these stats are calculated

Drawdown measures a fall from an earlier peak to a later low, including the starting value. Recovery is the first later observation that reaches that peak again. All peaks are reset at the start of the selected period; these are not lifetime drawdowns. The return chart above uses annual observations even when daily drawdown data is available.

The drawdowns for this record and SPX both use compounded calendar-year returns. Year-end sampling misses intra-year peaks and lows and understates the full drawdown. Recovery is also observed only at year-end.

  • Total return. Growth over the whole period, with distributions reinvested.
  • Best year. Highest calendar-year return in the selected period; earliest year shown if tied.
  • Worst year. Lowest calendar-year return in the selected period; earliest year shown if tied.
  • Positive years. Calendar years with a return above zero.
  • Years beating SPX. Calendar years with a higher return than SPY. Ties are excluded.

Maximum drawdown definition · Morningstar ↗

FURTHER READINGCNBC · about the Charitable Trust ↗

Public holdings, media appearances and estimated wealth do not establish a complete investment return.

Portrait credit

Andrew Aziz Cramer (cropped).jpg · Bear Bull Traders · CC BY 2.0 · displayed in original color with a CSS crop. · Portrait file
Sources & comparison notes · as of Dec 31, 2025

The arena features 34 investor profiles. Twenty selected vehicles are ranked by 10-year annualized outperformance versus SPY, the S&P 500 ETF. This is a dated research snapshot, not a live ranking of all investors. Figures are estimates from published annual returns or adjusted year-end NAVs and share prices. The record details identify the method and sources. Fundsmith and Fairfax are converted to USD. This is a return ranking, not a risk-adjusted assessment; the vehicles have different mandates and exposures. Charts use annual observations only. SPY is market-price total return; ARKK, GINDX, EPIVX and PSH are NAV returns after fund expenses. Berkshire is per-share market value. NAV and shareholder returns are different measures; these labels stay visible.

The homepage’s SPIVA figures cover all active U.S. large-cap funds, including growth, core and value styles. Over the twenty years from 2006–2025, 92.89% underperformed the S&P 500. The one-year and ten-year figures use the same category and end date. Fund returns are after fees, excluding sales loads. SPIVA includes funds that merged or liquidated during the period when calculating the share that failed to survive and outperform. These figures describe historical fund results, not the percentage of individual investors who will fail. See SPIVA Year-End 2025, Report 1a, page 12; methodology is in Appendix B, pages 41–42.

Annual data: ARK prospectus, 2016–2024 · ARK, 2025 · Berkshire · Gotham · Pershing Square · SPY annual returns · Fidelity: SPY 1Y / 5Y / 10Y cross-check · SPIVA.

GINDX is co-managed by Joel Greenblatt and Robert Goldstein. Berkshire is a conglomerate. PSH NAV includes the effects of its structure and buybacks; it is not its listed-share return. EPIVX is EuroPac International Value Class A at NAV, excluding its initial sales charge (up to 4.5%); including that charge reduces its published 10Y return to 10.84%. Peter Schiff is associated with the adviser and investment philosophy; James Nelson and Luke Allen manage the fund. It invests internationally, so SPY is an opportunity-cost comparison, not its mandate benchmark. Icahn’s figures are the published investment-fund composite, net of expenses, not IEP shareholder returns or his personal return. Annual observations cannot measure intra-year maximum drawdown. No risk score is fabricated. Historical performance does not establish future returns.

New annual records: EuroPac 2026 prospectus, Class A calendar-year chart · EuroPac December 2025 factsheet · Icahn annual reports: 2018 (2016–18), 2019, 2022 (2020–22), 2025 (2023–25).

Added records & portrait sources

The fourteen newly ranked records use the full 2016–2025 period. Adjusted-NAV estimates can differ slightly from published fund returns. Pabrai Fund 3’s conflicting headline ten-year figure is disclosed in its profile. Each record links to its data sources.

Prem Watsa · Will Danoff · Bill Ackman · Joel Greenblatt · Cathie Wood · Warren Buffett · Bill Nygren · Cliff Asness · Chris Davis · Mohnish Pabrai · Peter Schiff · Terry Smith · Mario Gabelli · John Rogers Jr. · Tom Gayner · Bruce Berkowitz · Dan Loeb · David Herro · John Hussman · Carl Icahn ·

Fourteen other profiles remain unranked while comparable records are reviewed. Fame does not establish performance.

Image credits, licenses & independence notice. Profile pictures use licensed original color photographs. Low-resolution photos may be AI upscaled; credits identify the source license and changes. Uncleared photos are withheld.